Apply ctSVG to Visium HD data
Haotian Zhuang
January 04, 2026
Source:vignettes/visiumHD.Rmd
visiumHD.RmdIntroduction
We will demonstrate how to use ctSVG to generate single-cell gene expression profiles and identify cell-type-specific SVGs from Visium HD data. The Visium HD dataset of a mouse brain tissue was downloaded from the 10x website.
Download Space Ranger output files and H&E image
The Space Ranger output files were downloaded at https://cf.10xgenomics.com/samples/spatial-exp/3.0.0/Visium_HD_Mouse_Brain/Visium_HD_Mouse_Brain_binned_outputs.tar.gz. The H&E image was downloaded at https://cf.10xgenomics.com/samples/spatial-exp/3.0.0/Visium_HD_Mouse_Brain/Visium_HD_Mouse_Brain_tissue_image.tif.
Perform nuclei segmentation
The nuclei segmentation results can be obtained by running segmentation methods, such as StarDist, on the H&E image accompanying the Visium HD data.
import pandas as pd
import numpy as np
from tifffile import imread, imwrite
from csbdeep.utils import normalize
from stardist.models import StarDist2D

img = imread('Visium_HD_Mouse_Brain_tissue_image.tif')

# Load the pretrained model
model = StarDist2D.from_pretrained('2D_versatile_he')

# Percentile normalization of the image
min_percentile = 5
max_percentile = 95
img = normalize(img, min_percentile, max_percentile)

# Stardist
labels, polys = model.predict_instances_big(img, axes='YXC', block_size=4096, prob_thresh=0.01,nms_thresh=0.001, min_overlap=128, context=128, normalizer=None, n_tiles=(4,4,1))

# Convert data format
data = [(cell_id, x, y) for cell_id, (xs, ys) in enumerate(polys['coord']) for x, y in zip(xs, ys)]
df = pd.DataFrame(data, columns=['Cell', 'X', 'Y'])

df.to_csv('nuclei.csv', index=False)
Load package
library(ctSVG)
mydir <- "~/Desktop/Research/ctSVG/visiumHD_mouse_brain"
list.files(mydir)
#> [1] "binned_outputs" "nuclei.csv"
Assign each square to a cell
suppressMessages(suppressWarnings(
  cellassignRes <- cellassign(visiumpath = file.path(mydir, "binned_outputs/square_002um"),
                              segmentationpath = file.path(mydir, "nuclei.csv"))
))
str(cellassignRes)
#> List of 2
#>  $ assign: Named chr [1:1858547] "Cell:21001" "Cell:21001" "Cell:21001" "Cell:21001" ...
#>   ..- attr(*, "names")= chr [1:1858547] "s_002um_00029_00776-1" "s_002um_00029_00777-1" "s_002um_00029_00778-1" "s_002um_00029_00779-1" ...
#>  $ coord : num [1:82357, 1:2] 355 365 363 364 362 ...
#>   ..- attr(*, "dimnames")=List of 2
#>   .. ..$ : chr [1:82357] "Cell:21001" "Cell:29526" "Cell:19243" "Cell:31821" ...
#>   .. ..$ : chr [1:2] "row" "col"
coord <- cellassignRes$coord
Generate single-cell gene expression profiles
count <- getexpr(cellassignRes = cellassignRes,
                 visiumpath = file.path(mydir, "binned_outputs/square_002um"))
str(count)
#> Formal class 'dgCMatrix' [package "Matrix"] with 6 slots
#>   ..@ i       : int [1:33493039] 42 109 198 243 291 364 561 627 744 763 ...
#>   ..@ p       : int [1:82358] 0 233 265 373 416 436 476 510 623 694 ...
#>   ..@ Dim     : int [1:2] 19059 82357
#>   ..@ Dimnames:List of 2
#>   .. ..$ : chr [1:19059] "Xkr4" "Rp1" "Sox17" "Lypla1" ...
#>   .. ..$ : chr [1:82357] "Cell:21001" "Cell:29526" "Cell:19243" "Cell:31821" ...
#>   ..@ x       : num [1:33493039] 1 1 2 1 5 1 1 1 3 1 ...
#>   ..@ factors : list()
Run Seurat pipeline
suppressMessages(suppressWarnings(
  d <- runseurat(count = count)
))
expr <- d@assays$RNA$data
sc <- d$seurat_clusters
str(sc)
#>  Factor w/ 26 levels "0","1","2","3",..: 13 13 13 13 11 14 4 3 11 2 ...
#>  - attr(*, "names")= chr [1:30558] "Cell:7101" "Cell:5729" "Cell:5749" "Cell:5892" ...
Reassign cells to clusters
In this vignette, n.max is set to 200 to reduce
computational time. By default, n.max is set to 1,000 in
practice.
recluRes <- recluster(d = d, n.max = 200)Identify spatially variable genes within each cell cluster
suppressMessages(suppressWarnings(
  clutestRes <- ctsvg_test(expr = expr, coord = coord, sc = sc, recluRes = recluRes)
))
head(clutestRes)
#>           cluster    gene           fdr          pval fdr.empirical
#> 0.C1ql3         0   C1ql3 1.557701e-293 1.535740e-297    0.05422556
#> 0.Snap25        0  Snap25 1.021168e-212 2.013542e-216    0.05422556
#> 0.Rab3c         0   Rab3c 1.371994e-184 4.057955e-188    0.05422556
#> 0.Nptxr         0   Nptxr 8.103704e-171 3.195782e-174    0.05422556
#> 0.Cyp26b1       0 Cyp26b1 1.441156e-165 7.104190e-169    0.05422556
#> 0.Man1a         0   Man1a 3.105247e-144 1.836881e-147    0.05422556
#>           pval.empirical fstat.ori
#> 0.C1ql3       0.00990099  78.98951
#> 0.Snap25      0.00990099  65.73079
#> 0.Rab3c       0.00990099  50.76282
#> 0.Nptxr       0.00990099  46.25440
#> 0.Cyp26b1     0.00990099  79.04013
#> 0.Man1a       0.00990099  41.00661
Fit spatial gene expression patterns within each cell cluster
clufitRes <- ctsvg_fit(expr = expr, coord = coord, sc = sc)Visualize spatial patterns of a single gene
plotGene(expr = expr, clufitRes = clufitRes, coord = coord, sc = sc,
         gene = clutestRes$gene[1], cellclu = "0", background = TRUE)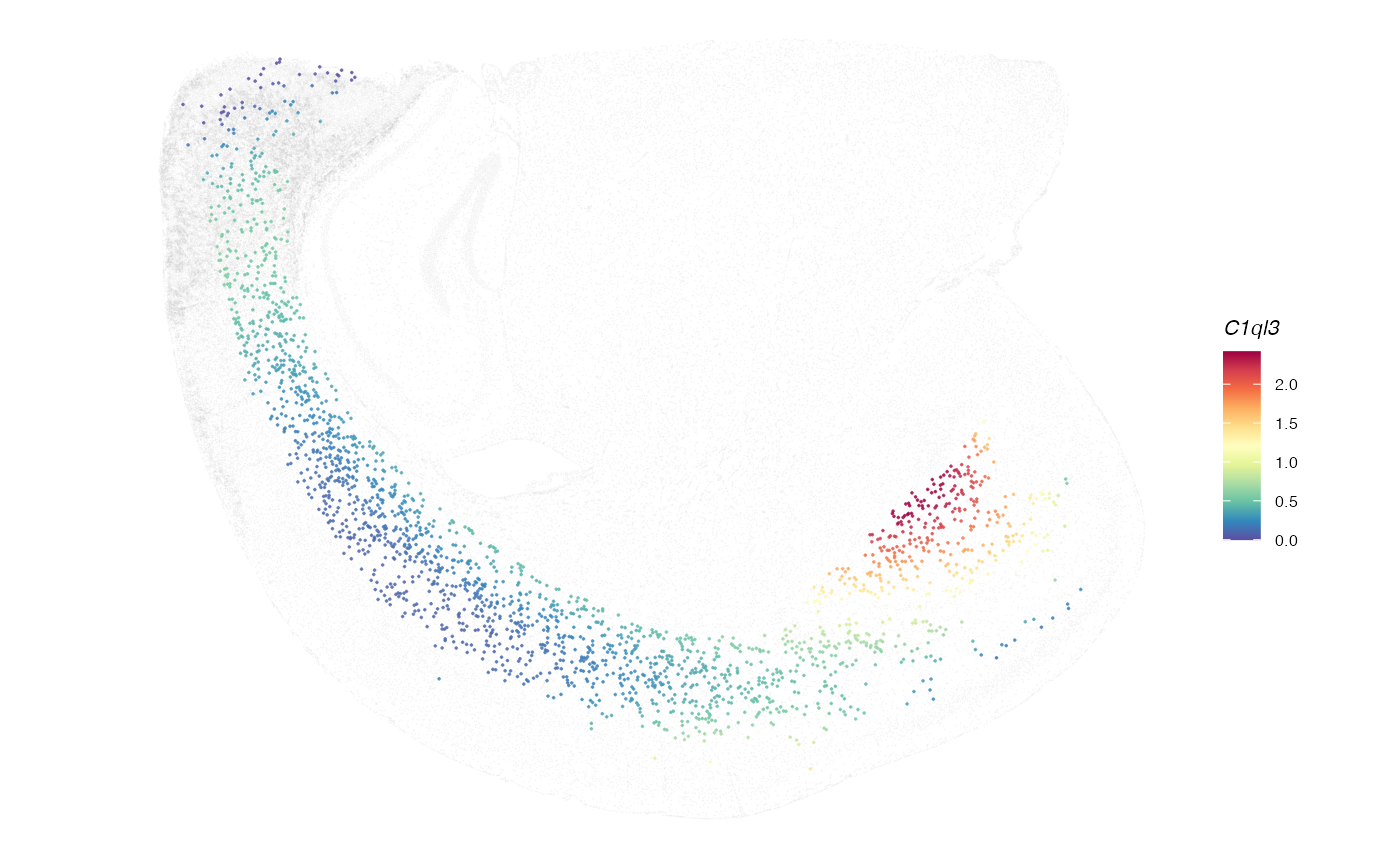
Identify gene modules within each cell cluster
moduleRes <- ctsvg_module(clutestRes = clutestRes, clufitRes = clufitRes, sc = sc)Visualize spatial patterns of metagenes within a cell cluster
plotMetagene(clufitRes = clufitRes, coord = coord, sc = sc,
             moduleRes = moduleRes, cellclu = "0", background = TRUE)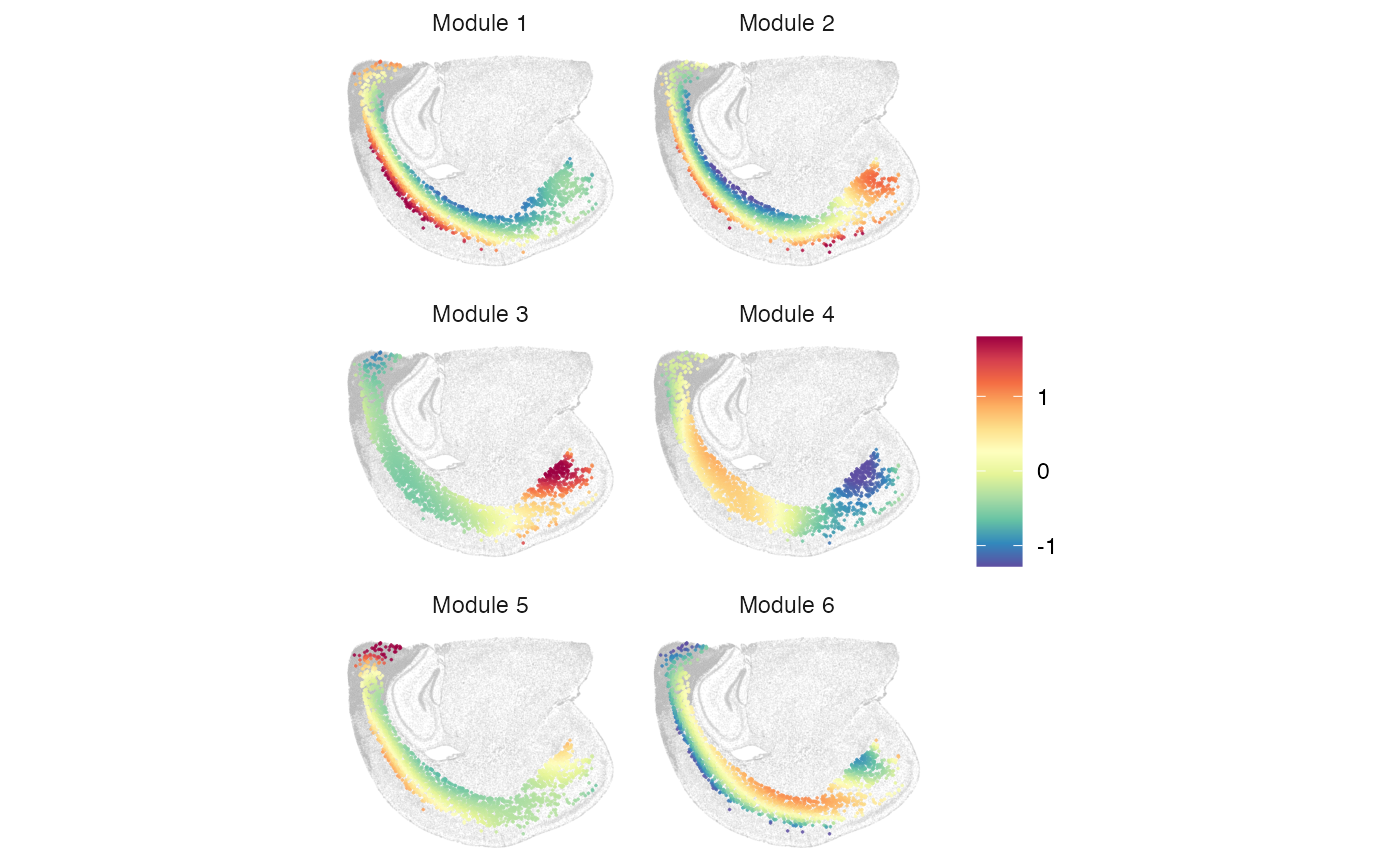
Session Info
sessionInfo()
#> R version 4.4.1 (2024-06-14)
#> Platform: aarch64-apple-darwin20
#> Running under: macOS 15.6.1
#>
#> Matrix products: default
#> BLAS:   /Library/Frameworks/R.framework/Versions/4.4-arm64/Resources/lib/libRblas.0.dylib
#> LAPACK: /Library/Frameworks/R.framework/Versions/4.4-arm64/Resources/lib/libRlapack.dylib;  LAPACK version 3.12.0
#>
#> locale:
#> [1] en_US.UTF-8/en_US.UTF-8/en_US.UTF-8/C/en_US.UTF-8/en_US.UTF-8
#>
#> time zone: America/New_York
#> tzcode source: internal
#>
#> attached base packages:
#> [1] stats     graphics  grDevices utils     datasets  methods   base
#>
#> other attached packages:
#> [1] ctSVG_1.0
#>
#> loaded via a namespace (and not attached):
#>   [1] RColorBrewer_1.1-3     rstudioapi_0.16.0      jsonlite_1.8.8
#>   [4] magrittr_2.0.3         spatstat.utils_3.1-0   farver_2.1.2
#>   [7] rmarkdown_2.28         zlibbioc_1.50.0        fs_1.6.4
#>  [10] ragg_1.3.2             vctrs_0.6.5            ROCR_1.0-11
#>  [13] spatstat.explore_3.3-2 S4Arrays_1.4.1         htmltools_0.5.8.1
#>  [16] findPC_1.0             SparseArray_1.4.8      sass_0.4.9
#>  [19] sctransform_0.4.1      parallelly_1.38.0      KernSmooth_2.23-24
#>  [22] bslib_0.8.0            htmlwidgets_1.6.4      desc_1.4.3
#>  [25] ica_1.0-3              plyr_1.8.9             plotly_4.10.4
#>  [28] zoo_1.8-12             cachem_1.1.0           igraph_2.0.3
#>  [31] mime_0.12              lifecycle_1.0.4        pkgconfig_2.0.3
#>  [34] Matrix_1.7-0           R6_2.5.1               fastmap_1.2.0
#>  [37] MatrixGenerics_1.16.0  fitdistrplus_1.2-1     future_1.34.0
#>  [40] shiny_1.9.1            digest_0.6.37          colorspace_2.1-1
#>  [43] S4Vectors_0.42.1       patchwork_1.3.0        Seurat_5.1.0
#>  [46] tensor_1.5             RSpectra_0.16-2        irlba_2.3.5.1
#>  [49] textshaping_0.4.0      labeling_0.4.3         progressr_0.14.0
#>  [52] fansi_1.0.6            spatstat.sparse_3.1-0  httr_1.4.7
#>  [55] polyclip_1.10-7        abind_1.4-8            compiler_4.4.1
#>  [58] proxy_0.4-27           withr_3.0.1            bit64_4.5.2
#>  [61] DBI_1.2.3              fastDummies_1.7.4      highr_0.11
#>  [64] MASS_7.3-60.2          rjson_0.2.23           classInt_0.4-10
#>  [67] units_0.8-5            tools_4.4.1            lmtest_0.9-40
#>  [70] httpuv_1.6.15          future.apply_1.11.2    goftest_1.2-3
#>  [73] glue_1.7.0             nlme_3.1-164           promises_1.3.0
#>  [76] grid_4.4.1             sf_1.0-18              Rtsne_0.17
#>  [79] cluster_2.1.6          reshape2_1.4.4         generics_0.1.3
#>  [82] hdf5r_1.3.11           gtable_0.3.5           spatstat.data_3.1-2
#>  [85] class_7.3-22           tidyr_1.3.1            data.table_1.16.2
#>  [88] XVector_0.44.0         sp_2.1-4               utf8_1.2.4
#>  [91] BiocGenerics_0.50.0    spatstat.geom_3.3-3    RcppAnnoy_0.0.22
#>  [94] ggrepel_0.9.6          RANN_2.6.2             pillar_1.9.0
#>  [97] stringr_1.5.1          spam_2.11-0            RcppHNSW_0.6.0
#> [100] later_1.3.2            splines_4.4.1          dplyr_1.1.4
#> [103] lattice_0.22-6         bit_4.5.0              survival_3.6-4
#> [106] deldir_2.0-4           tidyselect_1.2.1       miniUI_0.1.1.1
#> [109] pbapply_1.7-2          knitr_1.48             gridExtra_2.3
#> [112] IRanges_2.38.1         scattermore_1.2        stats4_4.4.1
#> [115] xfun_0.47              matrixStats_1.3.0      stringi_1.8.4
#> [118] lazyeval_0.2.2         yaml_2.3.10            evaluate_0.24.0
#> [121] codetools_0.2-20       tibble_3.2.1           cli_3.6.3
#> [124] uwot_0.2.2             arrow_17.0.0.1         xtable_1.8-4
#> [127] reticulate_1.39.0      systemfonts_1.1.0      munsell_0.5.1
#> [130] jquerylib_0.1.4        Rcpp_1.0.13            globals_0.16.3
#> [133] spatstat.random_3.3-2  png_0.1-8              spatstat.univar_3.0-1
#> [136] parallel_4.4.1         assertthat_0.2.1       pkgdown_2.1.0
#> [139] ggplot2_3.5.1          dotCall64_1.2          listenv_0.9.1
#> [142] viridisLite_0.4.2      e1071_1.7-16           scales_1.3.0
#> [145] ggridges_0.5.6         crayon_1.5.3           SeuratObject_5.0.2
#> [148] leiden_0.4.3.1         purrr_1.0.2            rlang_1.1.4
#> [151] cowplot_1.1.3